The dataset consists of signals acquired via one spatially-integrated sensor (an indium gallium arsenide (InGaAs) photodiode) mounted co-axially to the laser path, which measures the integral radiation within a field of view centered in the melt pool in the near/short infrared range. The photodiode signal was acquired during the manufacturing of one AlSi10Mg (aluminium) specimen produced with fixed process parameters (specifically, a scan speed of 1500 mm/s, laser power of 4800 W, and laser spot diameter of 100 µm). The specimen was manufactured using a multi-laser L-PBF Trumpf system.
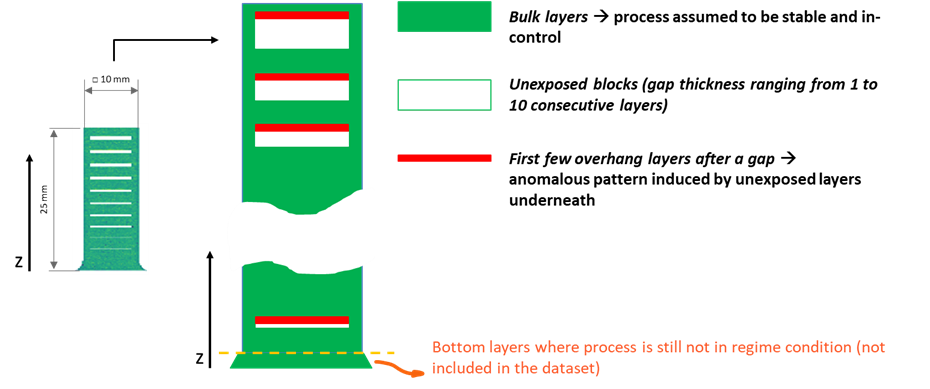
Within the specimen, anomalies were purposely introduced in specified layers by designing some unexposed blocks, i.e., inner regions of the specimen in which no laser scan occurred for a number of consecutive layers (ranging between 1 and 10). The first layer after an unexposed block has a large overhanging area with loose powder underneath. The heat exchange in this overhanging layer (and possibly in few of the layers that follow it) is altered by the fact that the loose powder has much less conductivity than the bulk material. Therefore, unexposed blocks tend to force heat conduction anomalies with increasing severity as the number of unexposed layers increases.
The photodiode signal was acquired during the production of one specimen. The specimen is a parallelepiped of size 10 x 10 x 25 mm. It was built vertically (i.e., the z direction is the build direction) in the L-PBF process (Fig. 2). In the bottom layers, corresponding to the tapered base area, the process was still not in its regime conditions, and so data collected during the production of such bottom layers are not included in the dataset. The number of unexposed layers within each unexposed block increased from 1 to 10 along the z direction.
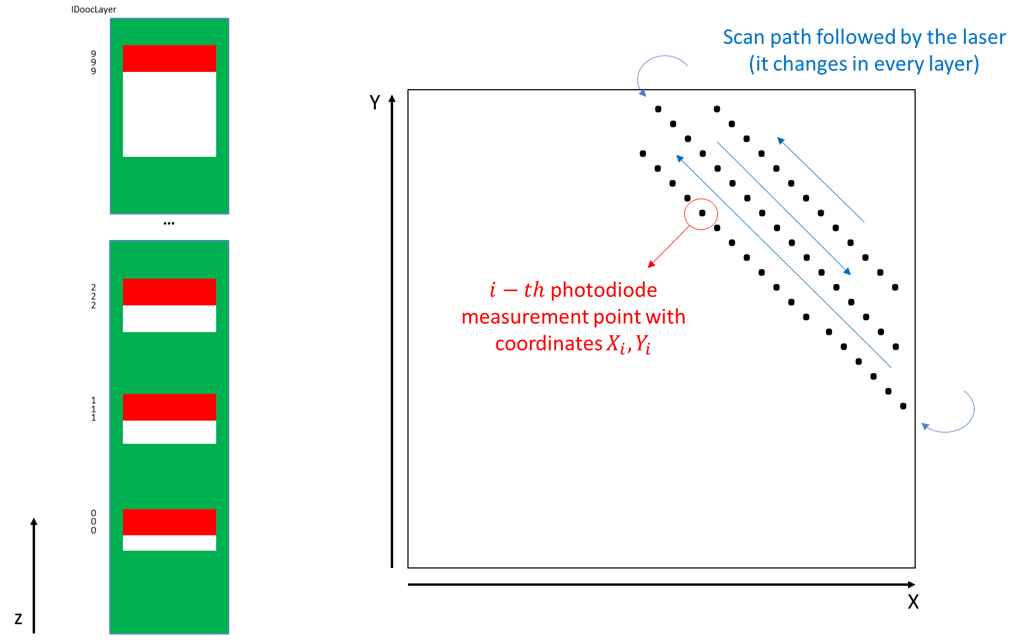
The photodiode signal was initially acquired with a sampling rate of 100 kHz and then down-sampled in order to have one datapoint every 30 µm along the laser scan path. The orientation of the laser scan direction and the laser scan path were changed every layer, as is commonly done in L-PBF. The dataset includes the X and Y coordinates of the laser spot (i.e., the coordinates of the center of the photodiodes’ field of view) recorded synchronously to the photodiode signals.
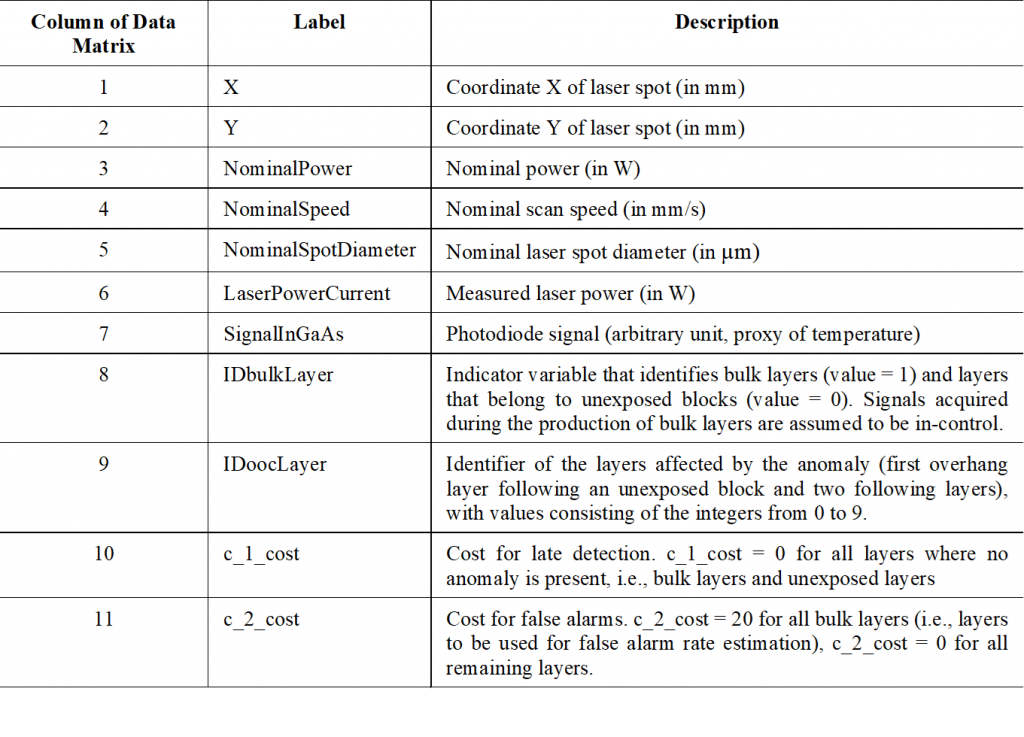
The dataset is in HDF5 format, with one file per layer. For each layer, a data matrix is provided in which each row corresponds to one photodiode measurement and different columns correspond to the different variables described in Table 1.
Table 1 – Contents of the data associated with each layer
The right panel of Fig. 3 provides a schematic representation of the link between the recorded laser spot locations (X and Y variables) and the corresponding photodiode measurement (SignalInGaAs variables). The left panel of Fig. 3 shows how anomalous layers are labeled in the IDoocLayer variable.